
Vietnam Renewable
Energy Market
Policy cadence, grid reinforcements, and capacity outlook across 2025–2030 — what's built, what's next, and where capital is rewarded.
Need to Know
Big runway, small base
Built to date: ~6 GW onshore wind and ~18.6 GW solar. 2030 adds are multi‑GW — room to grow. Total technical runway: ~2.3–2.9 TW across onshore/offshore wind and solar.
FiTs are over → market
FiTs ended. 2023 ceilings bridged the gap. New projects use corporate DPPAs and market‑based pricing (Decree 57, 2025).
Grid unlocks value
500 kV upgrades raise transfers: North–Central ~2.6 → ~4.0 GW; Central–South ~4.6 → ~5.6 GW. Circuit 3 live (2024‑08‑29).
Executive Summary
Small base, massive runway
Built to date: onshore wind ~6 GW, offshore ~0 GW, solar ~18.6 GW. Relative to technical potential (onshore ~217 GW; offshore 475–1,068 GW; solar ~1,646 GW), runway is large; 2030 PDP8 targets remain well above today.
FiTs → DPPAs/market
FiT era ended. 2023 ceilings applied to transitional projects (solar 5.05–6.43¢; wind 6.77/7.75¢). New projects contract via corporate DPPAs/market pricing (Decree 80: 2024‑07‑03; Decree 57: 2025‑03‑03).
Grid gating — improving
500 kV upgrades lift transfers: North–Central ~2.6 → ~4.0 GW; Central–South ~4.6 → ~5.6 GW. 500 kV Circuit 3 (~519 km) live since 2024‑08‑29; REACH sub‑projects track 2026 milestones.
Demand geography
North peaks ~27–28.5 GW; South ~15 GW; HCMC ~4.7–6.0 GW on hot days. Prioritize grid‑adjacent PV+BESS and wind near FDI parks/load pockets to reduce curtailment and improve DPPA bankability.
Where capital works
Utility solar + BESS (private wires), onshore wind optimization tied to grid upgrades, and C&I DPPAs (exporters, data centers). Offshore pushes into 2030s.
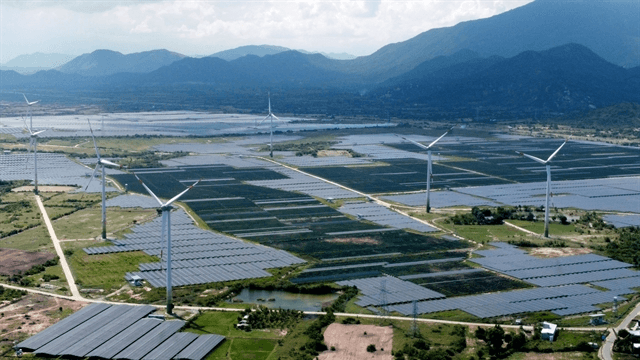
Wind and solar clusters emerge in coastal provinces
Utility-scale wind and solar concentrate in Central and South regions where resource quality, land availability, and grid access converge. Projects co-locate near 220–500 kV substations to manage curtailment risk and secure favorable network connection terms.
Northern demand ≈ 1.9× South
Where load is growing and why it matters for siting and DPPAs
- Load concentrates in the North and HCMC corridor, driving higher summer peaks and tighter capacity margins than the South.
- Industrial/FDI growth in coastal–industrial provinces and city clusters (e.g., HCMC and satellites) is pushing sustained demand growth and DPPA appetite.
- Provinces like Ninh Thuan post double‑digit consumption growth (2023 +10.8%; Jan–Apr 2024 +18.3% y/y) with high 220 kV loading (70–90%), underscoring the need to site close to load and backbone nodes.
- Corporate procurement is live (e.g., LEGO × VSIP DPPA), anchoring C&I offtake and enabling bankable pipeline segments ahead of full market liberalization.
- Grid enablement (500 kV reinforcements) expands north–south balancing, improving deliverability for new RE near demand centers.
Latest observed peaks (MW)
Provincial signal — Ninh Thuan
Sales 2023: 0.88 TWh (+10.79% y/y); Jan–Apr 2024: 293.954 GWh (+18.26% y/y). Installed capacity: 3,290 MW.
220 kV network typically runs 70–90% load; occasional high‑load periods when RE is strong.
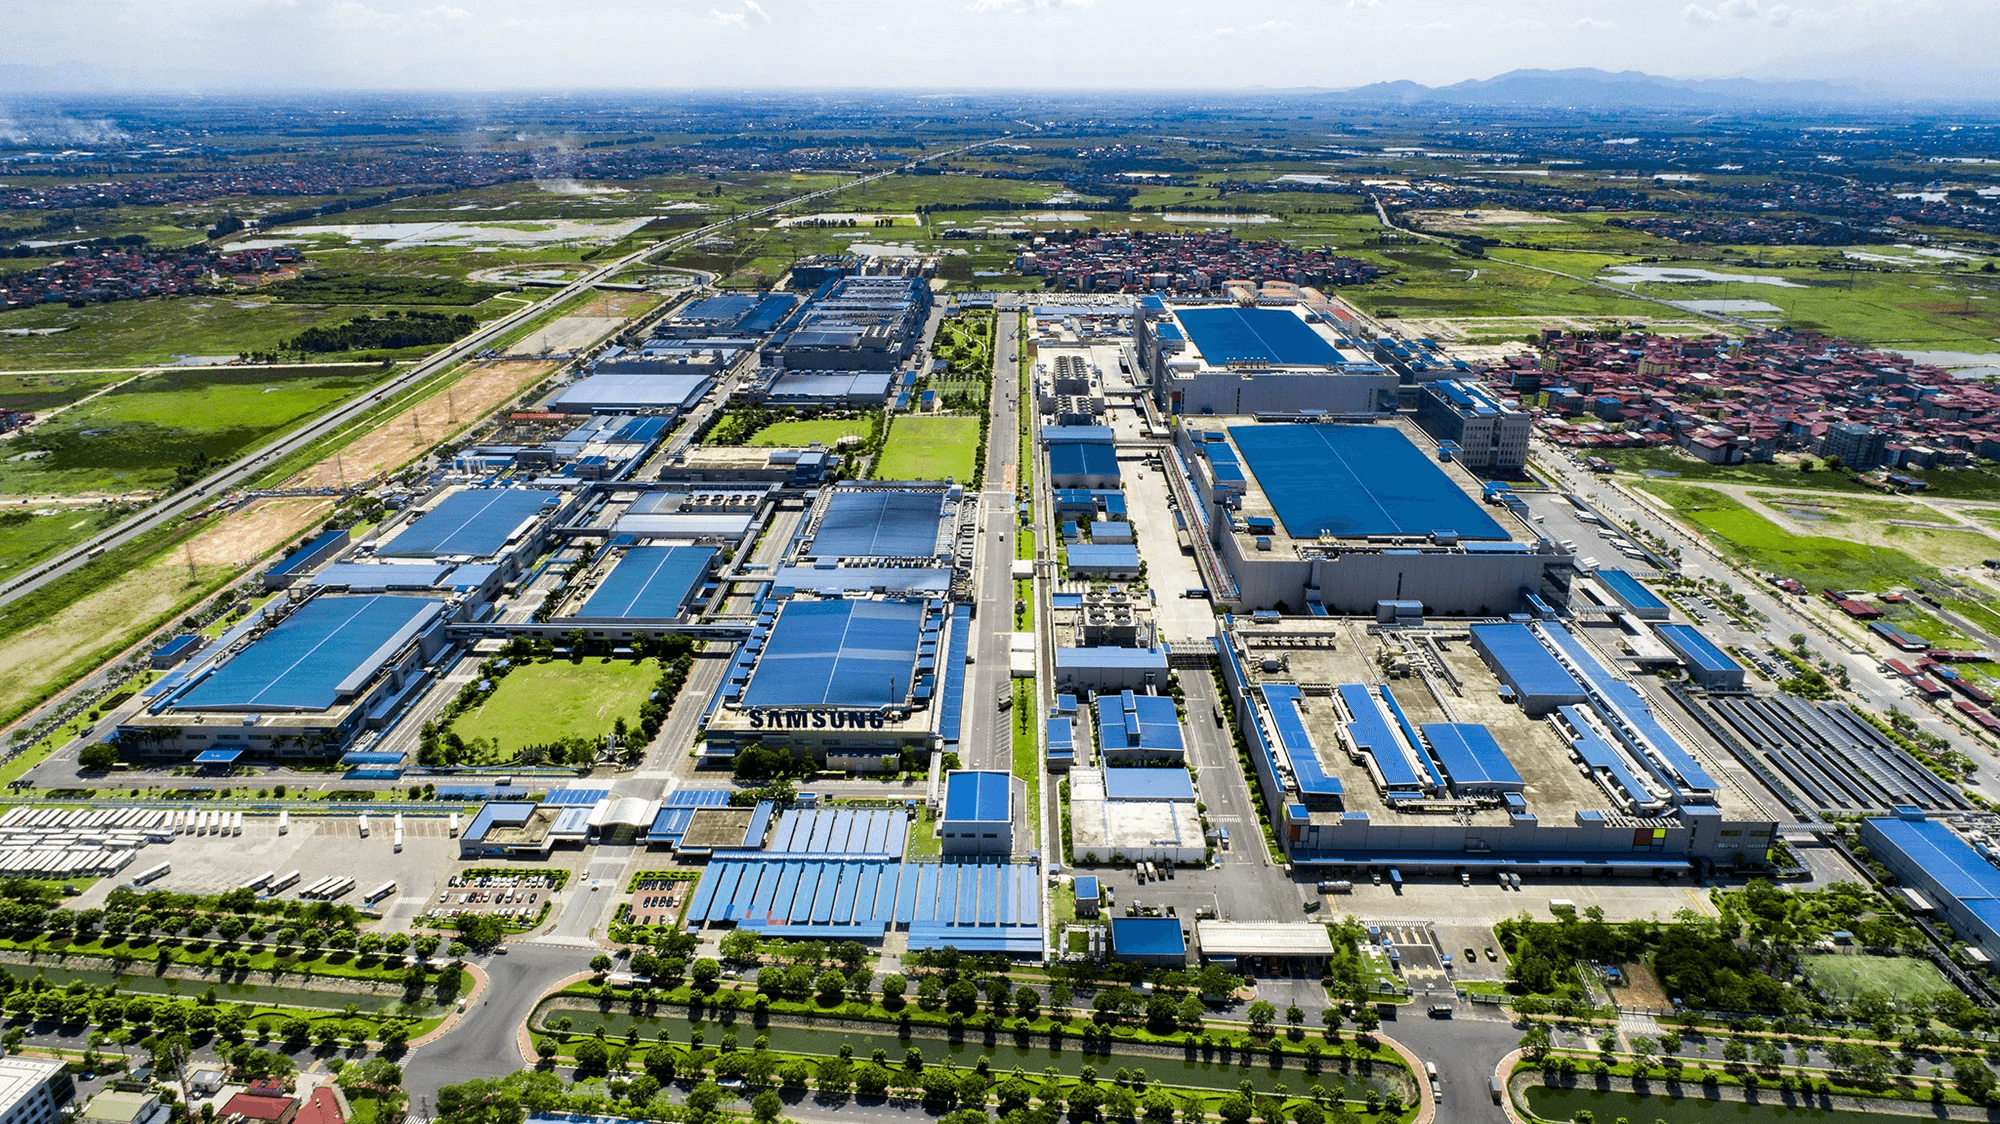
Northern industrial parks host outsized export manufacturing
Red River Delta provinces (e.g., Bắc Ninh, Bắc Giang, Thái Nguyên, Hải Phòng) concentrate large electronics and supporting supply chains. This clusters weekday loads and DPPA‑ready offtakers near 220–500 kV nodes, reinforcing the North's larger industrial presence.
HCMC corridor anchors rising commercial and industrial demand
Ho Chi Minh City and satellite industrial zones drive sustained electricity consumption growth, with peaks reaching 4.75–6.0 GW. Foreign direct investment in logistics, manufacturing, and data centers underpins corporate DPPA appetite and bankable offtake agreements.

Most recent, large FDI announcements and openings (through Oct 30, 2025)
Foreign‑led projects ≥~US$100m (plus one policy‑significant energy project), split by region
North
- Trump Organization + Kinhbac City — US$1.5b mixed‑use (golf/residential) — Khoái Châu, Hưng Yên (Red River Delta), approved May 2025. Reuters
- Amazon (Project Kuiper) — ~US$570m satellite ground infra & terminals — Bắc Ninh, disclosed Aug 2025. Reuters
- Samsung Display — US$1.8b OLED auto‑display factory — Northern Vietnam (govt announcement), Sept 2024. Reuters
- Foxconn (Hon Hai) — US$551m additional projects — Quảng Ninh (two factories), licences June–July 2024. Reuters
- JBS — US$100m (two food‑processing plants) — first at Nam Đình Vũ IP, Hải Phòng; MoU Mar 2025. Reuters
- Quảng Ninh LNG‑to‑power (Phase 1 ~US$2.2b) with foreign partners — land handover push Sept 2025. The Investor
South
- LEGO — ~US$1b manufacturing complex (opened) — VSIP III, Bình Dương (HCMC metro), opened Apr 2025. LEGO
- Sanofi + VNVC — ~US$77m vaccine facility — Long An (HCMC metro), launched May 2025. Reuters
Installed base is small; 2030 runway is multi‑GW
Installed capacity vs 2030 target range and technical potential (per technology)
Onshore wind
Offshore wind
Solar PV
• Installed = latest public estimates (H1 2025 context).
• 2030 target = PDP8 low–high range; not all volumes are guaranteed nor evenly phased.
• Technical potential is unconstrained by grid/land/permitting and should not be read as an investment target; used for scale only.
• Why this matters: the gap between installed and targets indicates multi‑GW runway but realization hinges on grid access, permitting cadence, and bankable offtake (DPPA/auctions).
Coal ~49.7%, Oil ~24.7% of energy supply (IEA 2023)
Total energy supply, Viet Nam (IEA 2023)
• PDP8 coal orientation (summary): Continue only projects in adjusted PDP7 and already under construction to 2030; consider fuel conversion (biomass/ammonia) for plants ≥20 years when economics allow; cease plants >40 years if conversion not feasible.
• By 2030: capacity in operation + under‑construction totals ≈30,127 MW. Expedite 6 projects (≈6,125 MW): Na Dương II, An Khánh – Bắc Giang, Vũng Áng II, Quảng Trạch I, Vân Phong I, Long Phú I.
• Not proceeding (≈13,220 MW): Quảng Ninh III, Cẩm Phả III, Hải Phòng III, Quỳnh Lập I–II, Vũng Áng III, Quảng Trạch II, Long Phú II–III, Tân Phước I–II.
• Why this matters: coal remains a significant part of supply this decade even as renewables scale; conversion/retirement timing influences curtailment, DPPA pricing, and system flexibility.
500 kV interfaces up to ~4.0 GW (N–C) and ~5.6 GW (C–S)
Historical vs updated operational capability
• Pre-upgrade network effectively two 500 kV circuits with ~2.4 GW practical transfer before reinforcements (GEAPP 2024).
• Abbreviations: N–C = North–Central; C–S = Central–South.
• Why this matters: South concentrates solar build‑out and curtailment risk; Central corridor hosts major wind/solar and acts as a transit; North has dense FDI/industrial load and peaky cooling demand. Higher transfer limits reduce curtailment, enable north–south balancing, and improve DPPA bankability.
National Grid Scale (end‑2023)
10.5k km 500 kV · 20.4k km 220 kV · 25.9k km 110 kV
Lines by voltage (km)
Substations (count)
Transformer capacity (MVA)
| Voltage | Total line length (km) | Substations | Transformers (MVA) |
|---|---|---|---|
| 500 kV | 10,471 | 41 | 71 (50,400 MVA) |
| 220 kV | 20,429 | 160 | 350 (75,849 MVA) |
| 110 kV | 25,932 | 1,118 | 2,042 (97,363 MVA) |
PDP8 — Northern 500 kV plan (lines & substations)
Raw snapshot for working use; normalize numbers as PDP8 updates finalize
New/Upgraded Lines
| Line name | Circuits × km | Note |
|---|---|---|
| West of Hanoi - Thuong Tin | 2 x 40 | New construction, connection of 500kV substation west of Hanoi |
| Circuit 2 Nho Quan - Thuong Tin | 2 x 75 | New construction, renovation of one circuit into two circuits |
| Hai Phong - Thai Binh | 2 x 35 | New construction, connection to Hai Phong 500 kV substation |
| Nam Dinh I - Pho Noi Thermal Power Plant | 2 x 123 | New construction and connection of Nam Dinh I TPP; if delayed, consider pre‑construction of SPP and 500 kV substation or alternative routing via Thanh Hoa - Nam Dinh I - Thai Binh - Pho Noi |
| Nam Dinh I TPP - Thanh Hoa | 2 x 73 | New construction |
| Thai Binh – branch to Nam Dinh I TPP – Pho Noi | 4 x 2 | New construction; connect to Thai Binh 500 kV substation |
| Lao Cai - Vinh Yen | 2 x 210 | New construction; connect 500 kV Lao Cai substation; power plant clearing; provision for import from China |
| Vinh Yen – branch Son La – Hiep Hoa and Viet Tri – Hiep Hoa | 4 x 5 | New construction; connect Vinh Yen 500 kV substation |
| Bac Ninh – branch Dong Anh – Pho Noi | 2 x 3 | New construction; connect 500 kV Bac Ninh substation |
| Connecting Hoa Binh Power Plant MR (transitional Hoa Binh – Nho Quan) | 2 x 2 | New construction (synchronous with Hoa Binh MR) |
| Thanh Hoa – branch Nho Quan – Ha Tinh | 2 x 5 | New construction; temporary connection ensuring supply |
| Cong Thanh – branch Nghi Son – Nho Quan | 2 x 5 | New construction; connect Cong Thanh TPP |
| Quynh Luu – Thanh Hoa | 2 x 91 | New construction; strengthen North Central – North transfer; replaces Quynh Lap – Thanh Hoa TPP line |
| Quang Trach – Quynh Luu | 2 x 226 | New construction; strengthen North Central – North transfer; replaces Vung Ang 3 – Quynh Lap 500 kV line |
| Vung Ang – branch Ha Tinh – Da Nang (M3.4) | 2 x 16 | New construction; transition to Ha Tinh – Da Nang 500 kV line circuit 2 |
| Vung Ang – Quang Trach | 2 x 33 | New construction |
| Long Bien – branch Pho Noi – Thuong Tin | 2 x 5 | New construction; connect Long Bien 500 kV substation |
| West of Hanoi – Vinh Yen | 2 x 44 | New construction |
| South of Hanoi – branch Nho Quan – Thuong Tin | 4 x 5 | New construction; connect 500 kV substation south of Hanoi |
| Dan Phuong – branch West Hanoi – Vinh Yen | 4 x 5 | New construction; connect Dan Phuong 500 kV substation |
| Son Tay – Dan Phuong | 2 x 20 | New construction; connect Son Tay 500 kV substation |
| Gia Loc – branch Thai Binh – Pho Noi | 4 x 13 | New construction; connect Gia Loc 500 kV substation |
| Hung Yen – branch LNG Nghi Son – Long Bien | 4 x 5 | New construction; connect Hung Yen 500 kV substation |
| Hoa Binh 2 cut‑off – Hoa Binh – Nho Quan | 4 x 5 | Connect 500 kV Hoa Binh 2 cut‑off station |
| Sam Nuea – Hoa Binh 2 cut‑off (VN segment) | 2 x 110 | New construction; Laos tie‑in; ~110 km on Vietnam territory |
| Hoa Binh 2 – West Hanoi cut‑off | 2 x 80 | New construction; release imported capacity |
| Lang Son – branch North 3 – Thai Nguyen (*) | 4 x 5 | New construction; synchronized per regional source build‑out |
Substations
| Substation name | Capacity (MVA) | Note |
|---|---|---|
| Van Tri | 750 | Renovations |
| West of Hanoi | 750 | Renovations |
| Long Bien | 750 | Renovations |
| Youth | 750 | New construction |
| Dai Mo (My Dinh) | 750 | New construction |
| Hoa Lac | 500 | New construction |
| Me Linh | 500 | New construction |
| Van Dien | 750 | New construction |
| Long Bien 2 (Gia Lam) | 750 | New construction |
| Soc Son 2 | 500 | New construction |
| Phu Xuyen | 500 | New construction |
| Hoa Lac 2 | 500 | New construction |
| Dan Phuong | 500 | New construction; connect 500 kV Dan Phuong |
| American Chapter | 250 | New construction |
| Cau Giay | 500 | New construction |
| Hai Ba Trung | 500 | New construction |
| Ung Hoa | 500 | New construction |
| Objects | 500 | Renovations |
| Hai Phong People's Committee | 500 | Renovations |
| Thuy Nguyen | 500 | Renovations |
| Duong Kinh | 500 | New construction |
| An Lao | 500 | New construction; consider machine 3 if necessary |
| Cat Hai | 500 | New construction |
| Dai Ban | 250 | New construction |
| Do Son | 250 | New construction |
Grid Reinforcements (REACH – P174460)
Priority lines and substations under implementation
| Project | Voltage | Type | Scope | Status (Oct 30, 2025) | Target | Sources |
|---|---|---|---|---|---|---|
| 500 kV North–South Circuit 3 | 500 kV | Line | ≈519 km 500 kV backbone reinforcement (circuit 3) | Energization completed 2024-08-29 (commissioned/operational). | Completed 2024-08-29 | |
| 500 kV Bắc Châu Đức (Ba Rịa–Vũng Tàu) | 500 kV | Line + Substation | ≈10 km 500 kV line + 950 MVA substation | In REACH scope since 2021; land/procedures ongoing; no public energization notice yet. | 2026 | |
| 500 kV Krông Búk → Tây Ninh 1 | 500 kV | Line | ≈300 km 500 kV double-circuit line | National priority; referenced in 2021–2026 build program; implementation/delayed; no official COD notice yet. | Q4-2026 (related approvals) | |
| 220 kV Phước Đông (Tây Ninh) – Substation upgrade | 220 kV | Substation Upgrade | Design 500 MVA; Phase 1: 250 MVA at Đôn Thuận, Trảng Bàng | Investment policy approved in 2025; aligns with REACH curtailment-reduction component; commissioning TBA. | 2026 (phase targets) |
• Purpose: accelerate grid capacity to integrate wind/solar and relieve congestion along north–south corridors.
• Why this matters: sub‑projects reduce curtailment risk near renewable zones and increase transfer margins toward load centers (HCMC & northern industrial parks).
• Schedule caveat: energization targets are indicative and subject to permitting/ROW and procurement timelines.
Installed vs potential: ~0–2.8%; vs 2030 targets: ~16–40%
Left: % of technical potential (upper bound). Right: % of PDP8 2030 targets.
Vs Technical Potential
Uses upper‑bound technical potential for conservative percentages.
Vs 2030 Target
Range reflects PDP8 low–high 2030 targets when applicable.
• Method: technical potential upper‑bound used as denominator for conservative %; PDP8 low–high range used for targets.
• Caveats: technical potential ignores grid, land, permitting; realized capacity will be lower. PDP8 volumes are subject to revisions.
• Why this matters: small % vs potential shows structural runway; % vs targets shows progress/lag and informs near‑term capacity additions.
Tariff Rates & Policy Regime
FiTs ended in Oct 2021. In 2023, temporary ceiling prices lowered rates versus FiTs while projects transitioned; from 2024–2025, DPPAs introduced market‑based pricing. Below we compare the headline FiT levels to the 2023 ceiling caps. DPPA dates are noted in the captions.
Solar: FiTs 7.09–9.35¢ vs ceilings 5.05–6.43¢
US¢/kWh
• FiTs = legacy fixed tariffs for COD by deadlines (ended 2021). Ceilings (2023) applied to transitional projects pending tariff negotiation.
• DPPA context: new builds increasingly rely on corporate PPAs/market prices; tariff structure, curtailment treatment, and settlement define bankability.
• Why this matters: headline rate drops vs FiTs compress revenue; corporate offtake and storage can improve realized capture prices.
Wind: FiTs 7.80–9.80¢ vs ceilings 6.77–7.75¢
US¢/kWh
• FiT0/FiT1 were technology‑specific fixed rates; window closed in 2021. 2023 ceilings capped transitional projects pending negotiation.
• DPPA context: price discovery shifts to corporate/market structures; merchant exposure and curtailment provisions influence leverage and returns.
• Why this matters: investors should evaluate capture price vs curtailment, and DPPA terms (tenor, indexation, penalties) rather than headline FiT.
Regional Peak Demand
North vs South vs Ho Chi Minh City — dated peaks across different observation periods
Policy & Regulatory Updates (2025)
DPPA (Decree 57) and strategic framework (Resolution 70)
Decree 57/2025/NĐ-CP — Direct Power Purchase Agreements (DPPA)
March 3, 2025
Establishes DPPA mechanism enabling direct contracting between renewable generators and large electricity consumers (grid/private line models), defines eligibility and contractual structures.
Resolution 70-NQ/TW — National Energy Security to 2030, Vision 2045
August 20, 2025
Politburo resolution setting strategic directions for green energy investment, market reforms, energy mix diversification, and private/foreign participation across the energy value chain.
Deal flow continues under market pricing (2024–2025)
Equity/M&A, transitional PPAs, and early DPPAs
| Date | Category | Parties | Details | MW | Status | Sources |
|---|---|---|---|---|---|---|
| Jun 20, 2024 | Equity & M&A | Sembcorp ↔ Gelex | Completed acquisition of a 245 MW renewables portfolio (solar/wind/hydro); earlier disclosed value S$218m (~US$160m). | 245 | Completed | |
| Nov 27, 2024 | Equity & M&A | ACEN → 49% of BIM Energy | ACEN acquired 49% of BIM Energy Holding for US$70.5m, expanding VN solar & wind JV platform. | — | Signed/Closed | |
| May 1, 2025 | Equity & M&A | Sembcorp ↔ Gelex (follow-on hydro) | 49 MW hydro asset completion delayed, approvals shifted into late-2025. | 49 | Delayed | |
| May 23, 2024 | Transitional PPAs | EVN (bulk transitional projects) | 63/72 wind/solar projects had negotiation minutes initialed and temporary tariffs approved (~3,429 MW). | 3429 | Operational (temporary tariffs) | |
| Sep 18, 2025 | DPPA / Corporate PPA | LEGO Manufacturing Vietnam × VSIP | One of the first DPPAs signed for the new LEGO factory (rooftop solar + BESS). | — | Signed | |
| Aug 23, 2024 | Context | Equinor exit | Equinor halted offshore wind plans and closed Hanoi office, underscoring offshore delays in 2024–2025. | — | Announced | |
| May 22, 2025 | Context | Payment/FIT disputes | Reports on retroactive cuts to some FiT PPAs and payment disputes affecting bankability. | — | Ongoing |
Sources
- GWEC (Sep 2025): onshore built ~6 GW
- PDP8 / revisions (2030 ranges)
- Reuters / ICON: offshore licensing status (2024–25)
- World Bank (2021): 475 GW offshore potential
- MAE/UNDP (2025): 1,068 GW offshore atlas
- REN21 (2024): solar installed ~18.6 GW (2023)
- U.S. ITA: solar technical ~1,646 GW
- IEA (2023) energy mix – Viet Nam
- PV Tech: Sembcorp–Gelex 245 MW portfolio (Jun 2024)
- PSE EDGE disclosure: ACEN–BIM (Nov 2024)
- Business Times: Sembcorp 49 MW hydro delay (2025)
- EVN News: Transitional projects update (May 2024)
- LEGO: DPPA announcement (Sep 2025)
- Reuters: Equinor exits Vietnam offshore wind (Aug 2024)
- Reuters: Retroactive FiT issues/payment disputes (May 2025)
- EVN: Ninh Thuan power supply situation (2024)
- World Bank – REACH ESMF (grid sub-projects)
- Báo Đắk Lắk – Krông Búk 500 kV line
- EVNNPT – 220 kV Phước Đông approval
- Báo Chính Phủ – Tây Ninh approvals & schedule
- EVN / EVNNPT – 500 kV North–South circuit 3 energization (Aug 29, 2024)
- Decree 57/2025/NĐ-CP — DPPA (Mar 3, 2025)
- Resolution 70-NQ/TW — National Energy Security (Aug 20, 2025)